Hi, I'm Fereshteh Amini,
A Data Visualization Designer and Researcher.
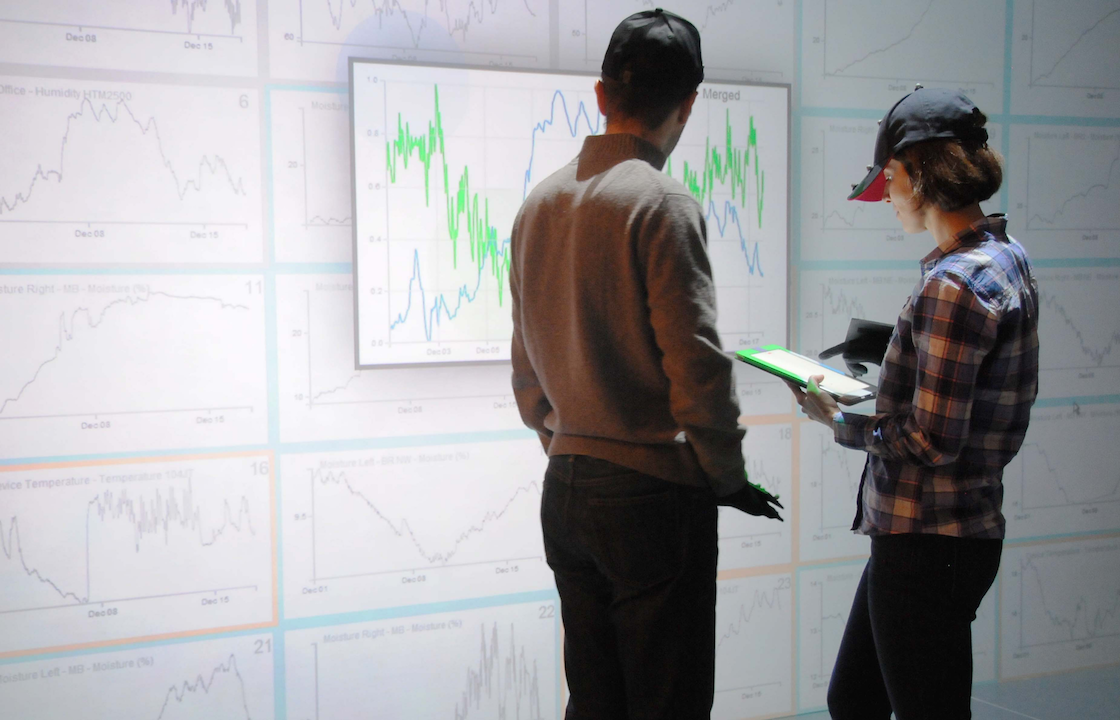
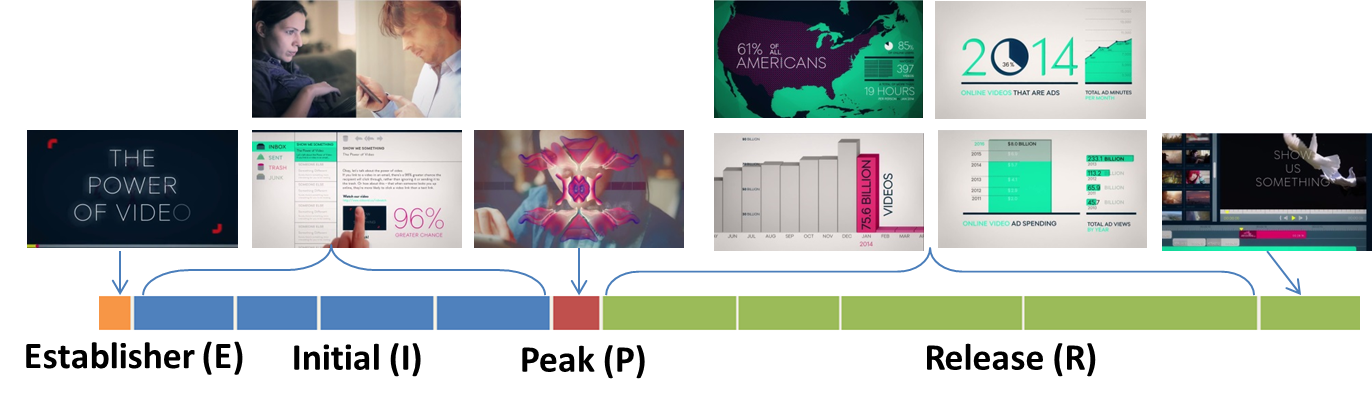
I am a senior applied data scientist at Microsoft Corp. I study different factors impacting productivity and how people conduct work. I also design and research information visualization and storytelling tools, techniques, and approaches for visual communication of data insights to broad audiences.
I am also a lecturer at UCBerkeley Information School, where I teach a course on Information Visualization and Communication as part of the MIDS (Master In Data Science) program.
During my PhD studies at the University of Manitoba, I have had the chance to collaborate with several great researchers around the world and have published my research in leading venues in Human-Computer Interaction and Information Visualization. I have had the chance to work with several great researchers around the world and have completed research internships at Tableau Inc. working with Dr. Robert Kosara in 2017, and Microsoft Research working with Dr. Nathalie Hery Riche in 2016. Prior to starting my PhD I worked at IDERS Inc. (GE Transportation), where I worked as a user interface developer and in a team lead position for more than 4 years.